Introduction:
In Lab 8, the class split up into groups and collected microclimate data in one of the seven designated zones on the University of Wisconsin-Eau Claire campus and then compiled all the data together. The data that was collected in ArcCollector on the smart phones was then accessed on ArcGIS Online and exported to be opened in ArcMap. Different maps were created to show each of the attributes of data collected. More information regarding the previous lab can be found
here. The objective of this lab was to create individual projects that answered a spatial question. The requirements were to think of a point feature to gather and then decide what attributes would be associated with that particular point.
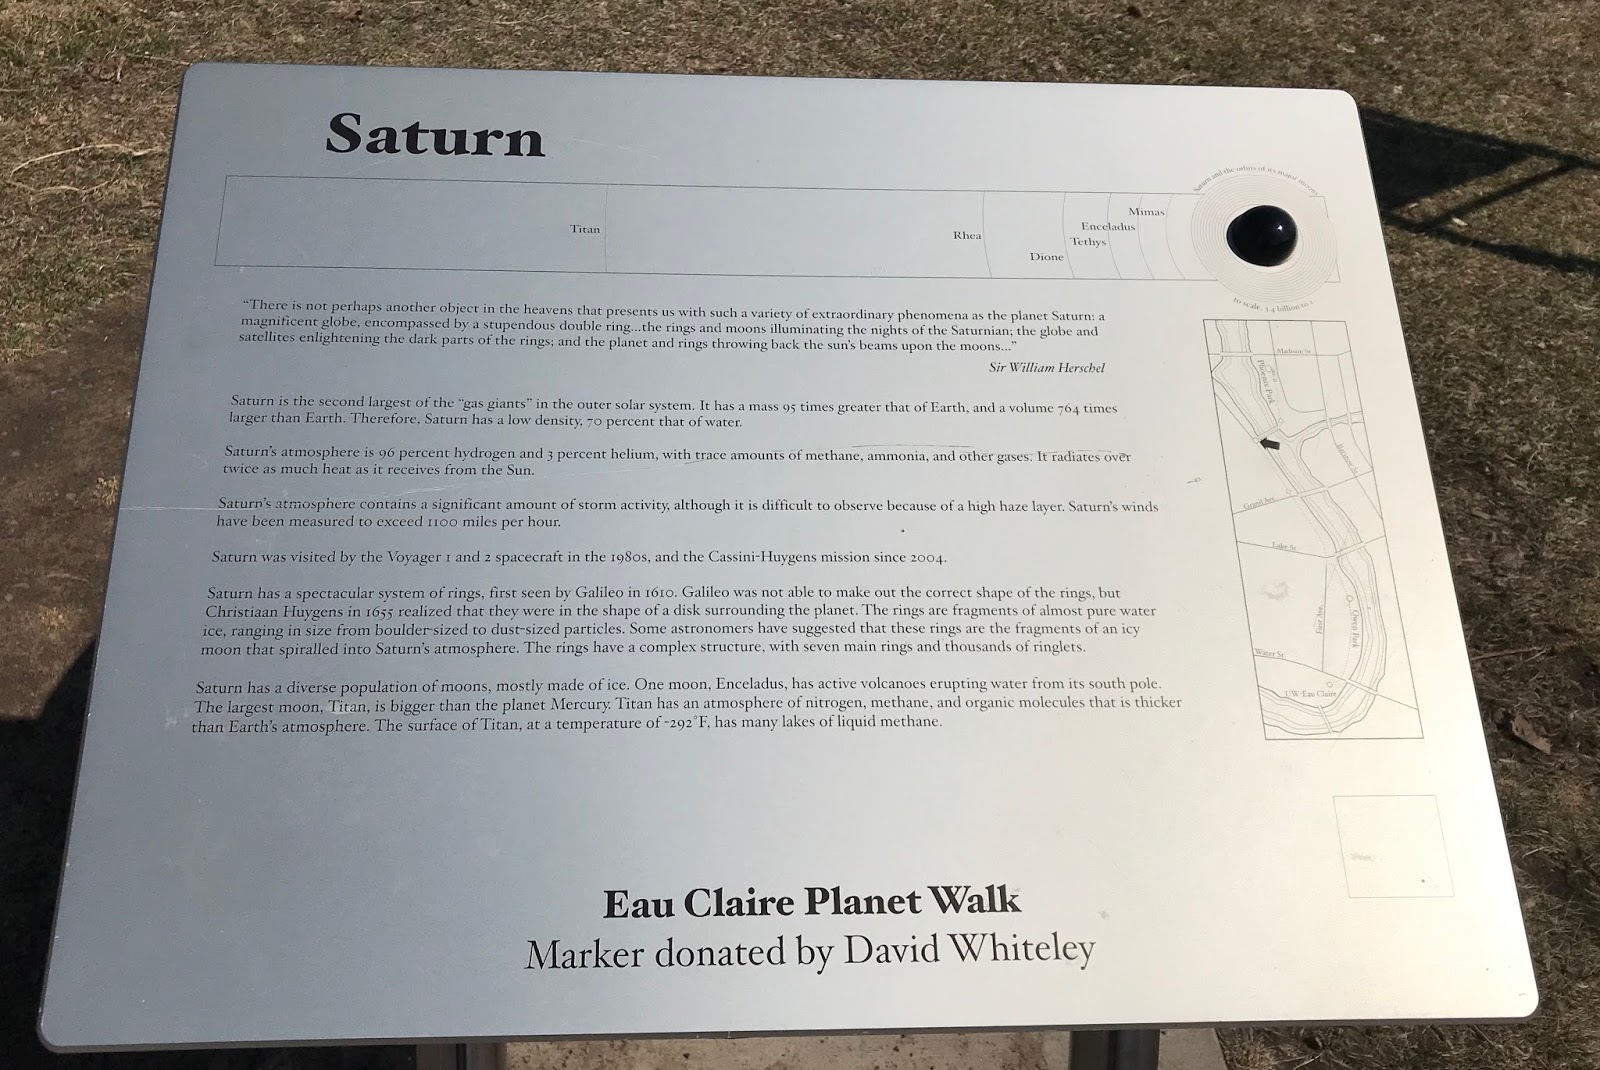
The Eau Claire Planet Walk is a one-mile scale model of the solar system that has a beautiful view of the Chippewa River along the route. Throughout the mile walk, there are a small monuments representing the planets along the route that are located along the scaled model of where they would be in relation to distance in the solar system. Each monument
(Figure 1) includes a very detailed description and other fun facts about that specific planet as well who the monument was donated by. There is also a small map on each monument to show where how far long the route that planet is.The spatial question for this lab was determining whether the scale model of the solar system is an accurate representation of the real life distances of the planets to the sun. Attributes that were collected for this lab were planet name, distance from the sun in astronomical units, radius of each planet, condition of the monuments, and a notes section that included information regarding who the monument was donated by. To complete the lab, the long process of creating a geodatabase needed to be attained. This was a very important step in the process in collecting accurate data. ArcCollector was used to retrieve the data so then it could be analyzed on ArcGIS online.
 |
| Figure 1: Saturn Monument |
Study Area:
The study area for the research project spanned from Phoenix Park to the end of Randall Park
(Figure 2). The route is paved and ends up leading to a bridge that crosses the river. The Sun is in Phoenix Park and Pluto is in Randall Park. The walk is welcome to start at either park depending on which end of the solar system the walker would like to start at.
 |
Study Area: Eau Claire Planet Walk
|
Methods:
After deciding what the spatial question and attributes would be, it was time to create fields and domains to be used in ArcMap. A detailed step by step process on ArcGIS Online demonstrates how to create this. Going to properties in the database, the domains and their descriptions could be added (
Figure 3). The domains could be set to different types. For example, the Condition domain was set to coded values: perfect, good, fair, inadequate. The field type was also changed to either text, long integer or float. During the process, a decision was made to record the distance from the planets to the sun by astronomical units because that is the commonly used measurement for solar distance. Each domain helped to represented each monument while aiding with the spatial question.
 |
| Figure 3: Creating the domains |
After the domains were created, the data needed to be shared to ArcGIS online to be used for the online map. Once signed in to ArcGIS in ArcMap, the option to connect to My Hosted Service allowed the data to be shared (
Figure 4). Another important step was to the check the boxes of Create, Update, Delete, and Sync in the Feature Access tab to allow changes to be made while collecting the data. Once all of the necessary steps were completed, the data could be published to ArcGIS Online to then be used in ArcCollector.
 |
| Figure 4: Publishing process to ArcGIS Online |
Using ArcCollector on a smart phone, the data points were recorded at each planet monument along the Eau Claire Planet Walk route (Figure 5). Data was recorded within the appropriate domains.
 |
| Figure 5: Recording data in ArcCollector |
Results:
Once all the data points were collected, they were analyzed in a map in ArcGIS Online. The link to this online map can be found
here. There is an option to select the individual points to where a pop-up window appears displaying the attribute information about each of the monuments (
Figure 6). The figure below shows the Neptune monument with all the information of each attribute except for the Notes section. This was a user error that occurred within the process. Who the monument was donated by was recorded in the notes section for each planet in ArcCollector but it did not save or show up in ArcGIS Online. It was discovered that the field type was set to Float instead of Text while creating the domains back in the beginning. This error just proves that the initial domain creation is very important when collecting data because one wrong step could end up disrupting the results.
 |
| Figure 6: Pop-up window in ArcGIS Online |
Next, the data was exported to be used in ArcMap to create several maps.
Figure 7 shows the difference of condition between each of the planet monuments. Condition was determined whether there were scratches or dents on the surface of the monument where the text was located. It appeared that most of the monuments were in perfect or good condition. The fact that all the monuments are outside and exposed to the atmosphere and people passing by makes it difficult for them to stay in perfect condition. The only monument that is free from outside conditions is the sun monument in the Phoenix Park (
Figure 8). The monument plaque is enclosed in a glass case free of outside conditions.
 |
| Figure 7: Monument Condition |
 |
Figure 8: Sun Monument at Phoenix Park
|
The next two maps show distance (
Figure 9) and radius (
Figure 10) in relation to the planets. The radius is represented in miles and is shown in different sizes along the route. Each monument is the same size except for the sun so it is beneficial to compare model scale real life measurements on a map to compare how the sizes of the planets look in the solar system. The map shows how the planets closer to the sun are smaller and then further out they get bigger and then start to get small again. The real life distance from the sun was measured in astronomical units because that is a commonly used used measurement relating to the solar system. One astronomical unit is equal to about nine million miles which is shown on the map. This map helps to answer the study question by tracking the planet monuments and then recording the real life distance.
 |
| Figure 9: Planet Real Life Radius Size in Miles |
 |
| Figure 10: Real Life Distance from the Sun in AU |
Conclusion:
This lab demonstrated the importance of the initial planning and proper project design of data collection. The process is long and detailed and steps can easily be missed or performed inaccurately. Personal error caused missed data results because of a mix up while creating the domains. The actual data collection is the most exciting part of a research project but it is extremely important to have everything set up correctly so that the results are the most accurate they can be. For this research project, the Notes attribute were not the most important attribute so that it didn't really affect the results but that information would have been nice to have. The answer to the spatial question was that the scale model of the solar system does not perfectly represent the real life version. However, the Eau Claire Planet Walk is still a route that provides people descriptive information about the planets in our solar system while presenting beautiful views of the Chippewa River. For a future research project, it would be interesting to determine a study question that would involve collecting more data points in small area compared to fewer data points in a large area.


No comments:
Post a Comment